Performance Review Analytics
Use the Performance Reviews Dashboard for quick access to the information you need.

Chase Stragglers, and Spot Problems
Once a review cycle is underway, you have two major interests: tracking progress and analyzing the results.
Our improved Review dashboard helps with both, giving you valuable insight and saving you time on exports.
Read on or watch the video to learn how the Review dashboard can make your life easier.
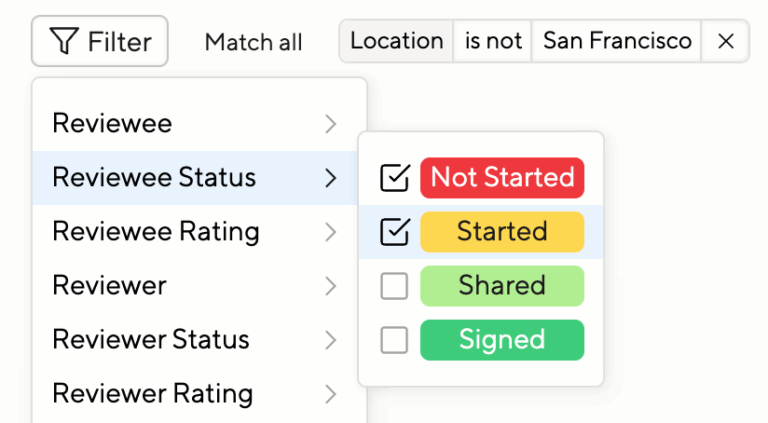
Powerful Filtering
When tracking progress, you can filter by multiple criteria providing intersecting data.
For example, you can easily find everyone who has not started nor shared a review yet, and who is not based in San Francisco.
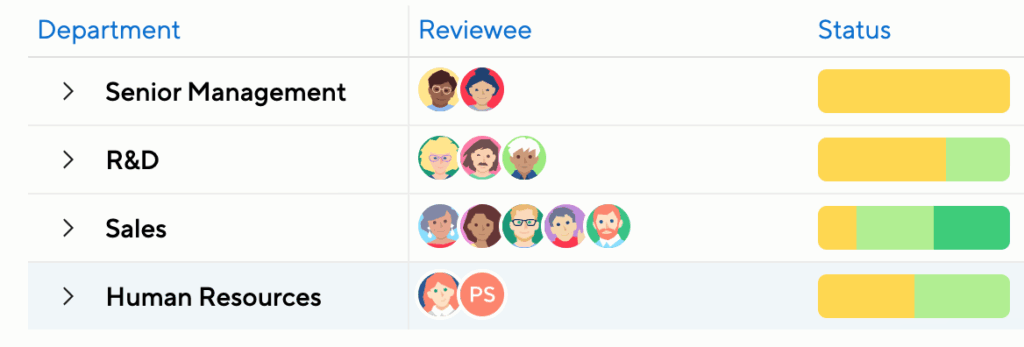
Effective Grouping
Rather than just filter or sort by review status, you can get an overview of where entire departments or locations stand. Select “Group by” and pick “By department,” for example.
You’ll see all your departments and their progress at a glance. In this example, it’s obvious that Sales is tracking nicely but the other departments are behind.
Custom Columns
The Review dashboard allows you to select exactly what columns and demographics you’d like to see. In addition to the standard columns, you may choose from
- the delta between self-assessment and manager-rating
- the delta between 2D-chart assessment
- a person’s tenure
- a person’s gender
- whether a person is still active at your organization.
- and all rated questions from your reviews
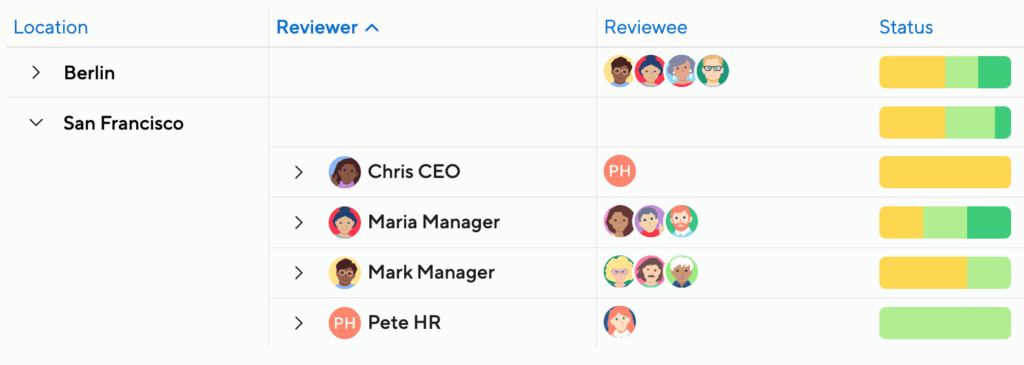
Nested Status Reporting
In a more complex organization, you may need fine-grained reporting. For instance, you could group first by location, and then by manager. Or first by department, then by team.
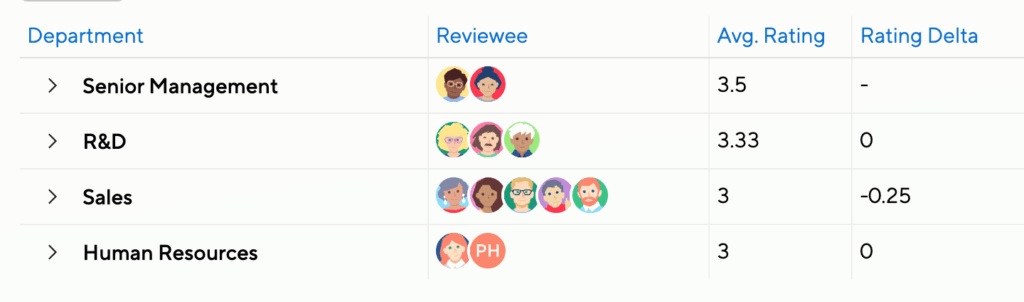
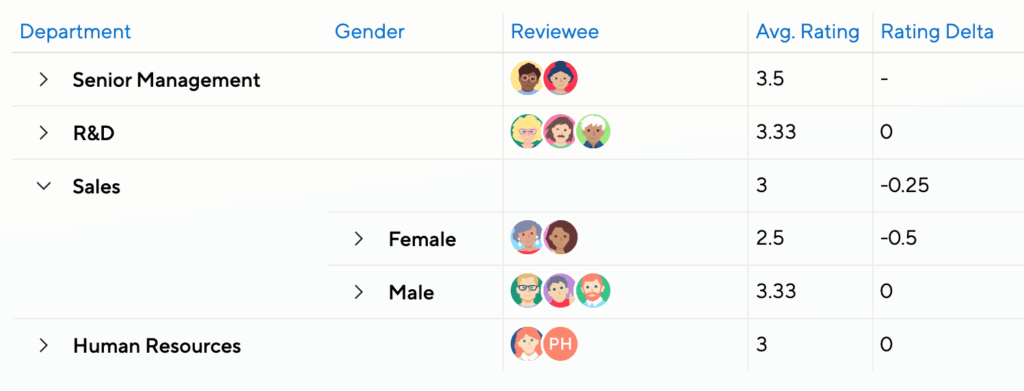
Average Rating Reporting
When grouping by department, for example, you can immediately see the average manager rating and the average self-assessment in this department. Rating deltas are also a powerful way to track alignment.
This way you can easily identify major rating trends or gaps.
Dive Deeper
Sometimes the problems lurk under the surface. Enable subgroupings to identify things a level down. In this example, there’s a rating gap on gender, but only in the Sales Department.
If you felt that this could be skewed by new starters, you could also user filtering to exclude people based on tenure.
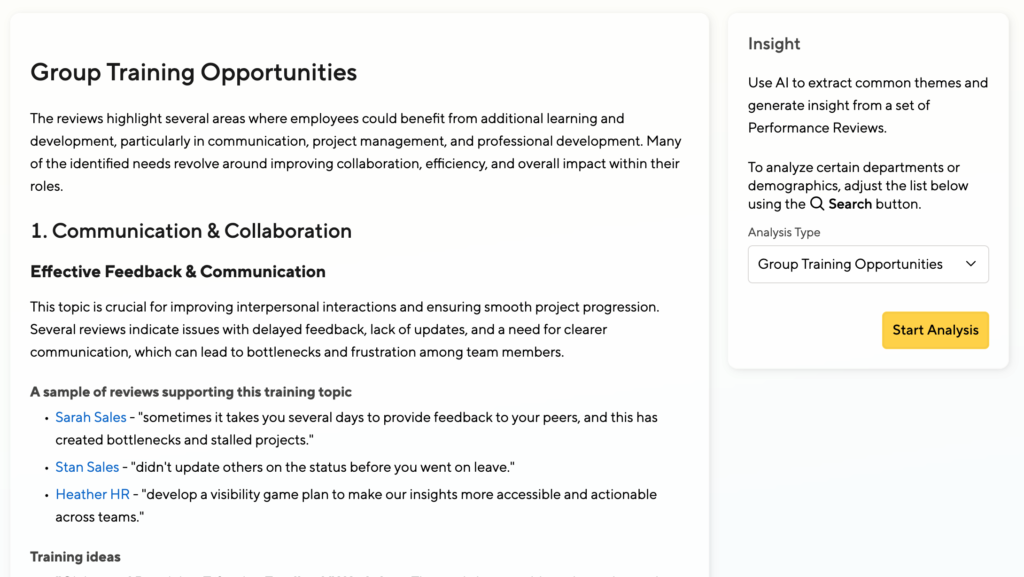
AI Cycle Insights
In addition to numerical analytics, you can get deeper insight into your teams or departments (or other demographics) with AI.
Learn about general themes, spot inappropriate language, take note when there is a gender gap in feedback, and identify qualification gaps.
This way you plan what department needs what training initiative. Learn more here.
Cross-Cycle Reporting
Running multiple cycles in parallel? Curious about a team’s performance trajectory over time?
You can consolidate the results of several review cycles into one unified report, with advanced filtering and sorting options to help you slice and dice your data according to your needs.
Just select multiple cycles at the top of the list.
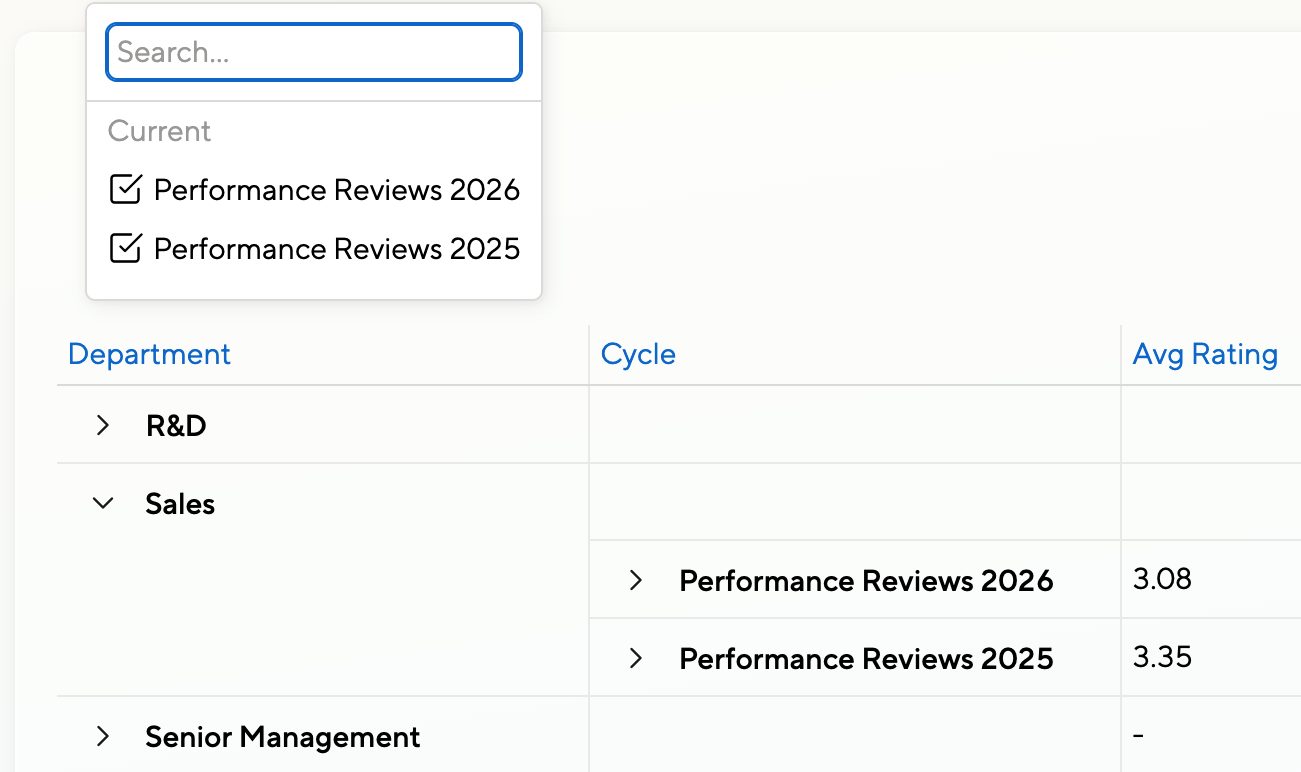
Cross-Cycle in Action
Take a deeper look at Cross-Cycle Reporting in combination with grouping and filtering.
More to Come
Stay tuned for more features like automated anomaly detection, interactive AI analysis, improved charting, and more. You can track our progress on the Coming Soon page in your Admin Menu, or reach out directly to us at product@small-improvements.com
